Resource Allocation Patterns in Online Multi-Table Tournament Participation
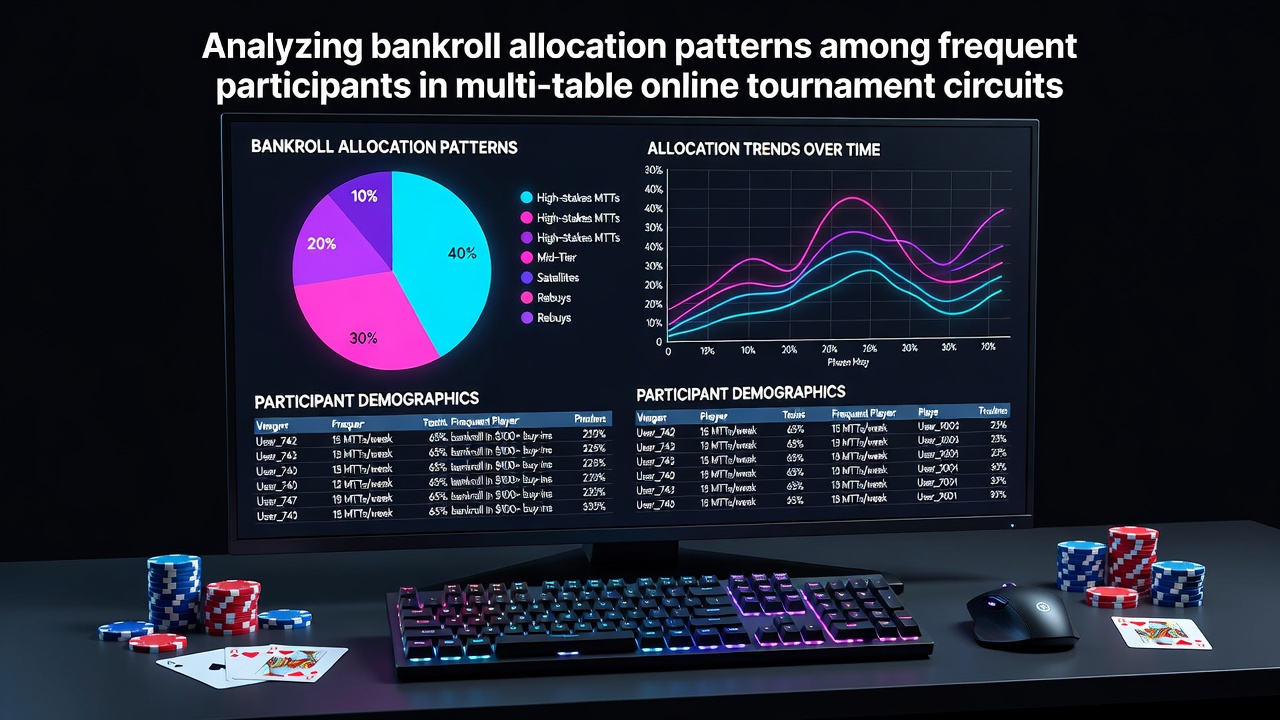
Analysts tracking online poker circuits have documented distinct bankroll allocation patterns among players who compete regularly in multi-table tournaments, and these patterns emerge from large-scale platform data collected across major sites through the first half of 2026. Frequent participants tend to divide their total available funds into segments that reflect entry fee levels, expected volume of play, and variance management protocols, while researchers note that allocation percentages often shift based on tournament buy-in ranges and player experience tiers.
Observed Distribution Frameworks
Data sets from tournament tracking services show that dedicated players commonly reserve between 20 and 40 percent of their overall bankroll for lower-stakes events under $50 buy-ins, whereas they channel 35 to 50 percent toward mid-tier tournaments ranging from $50 to $300. Higher-stakes events above $300 typically receive 15 to 25 percent allocations, and those figures come from aggregated session logs compiled through June 2026. Observers note that this tiered approach allows participants to maintain volume without exposing the entire bankroll to single high-variance swings, and the same datasets reveal that players who maintain at least 50 buy-ins for their chosen stakes exhibit lower dropout rates during downswings.
Influences on Allocation Decisions
Platform analytics further indicate that time-of-year factors and series schedules affect how competitors spread their resources. During major online festival periods that peak in July 2026, allocation toward flagship events increased by roughly 12 percent compared with off-peak months, while regular weekly tournaments absorbed the balance. Those who've examined player behavior records point out that participants often adjust these percentages after reviewing personal return-on-investment statistics, and software tools that overlay historical results help refine such adjustments. External variables such as deposit bonuses and rake structures also factor into the equation, since reduced effective costs can free up portions of the bankroll for additional entries without altering core risk parameters.
Comparative Data Across Player Segments
Breakdowns by experience level demonstrate measurable differences. Novice multi-table participants frequently commit larger relative percentages to single events, sometimes exceeding 5 percent of total funds per tournament, whereas veterans cap individual entries at 1 to 2 percent. Studies conducted by independent research groups have quantified this gap, and one analysis covering North American and European player pools found that experienced competitors sustain longer participation streaks when they adhere to stricter allocation caps. The same research highlights that players who diversify across multiple buy-in brackets tend to experience steadier bankroll trajectories than those who concentrate funds in one bracket.
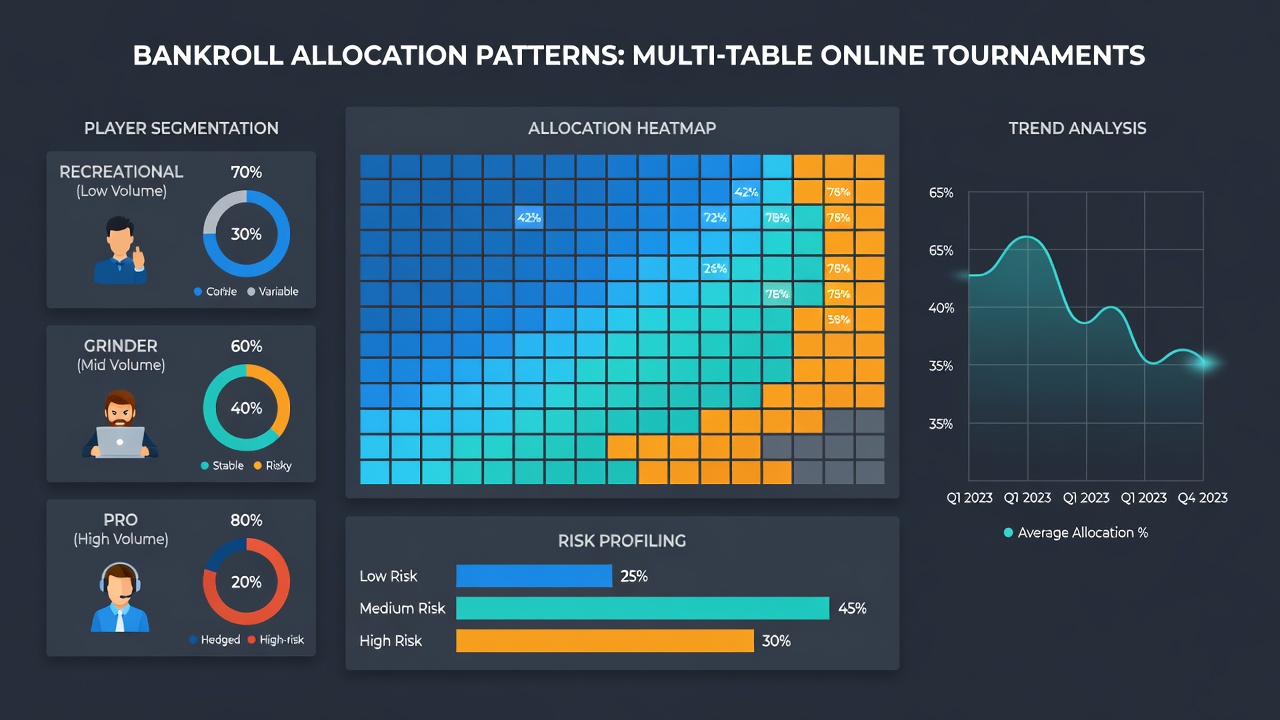
Additional patterns surface when examining session frequency. Players logging more than 15 multi-table sessions per week typically maintain smaller per-event allocations to accommodate volume, and this approach aligns with variance models that project required reserves. Figures released by academic gambling research centers in Australia and Canada corroborate these trends, showing that high-volume participants who recalibrate allocations quarterly reduce the likelihood of extended drawdowns. Software providers that supply real-time bankroll dashboards have contributed to this recalibration process by surfacing precise percentage breakdowns after each completed series.
External Factors and Recent Trends
Regulatory changes outside the United Kingdom have also shaped allocation habits. Updates to deposit and withdrawal frameworks in several jurisdictions during early 2026 prompted some players to hold larger cash reserves outside active tournament funds, thereby altering the proportion available for immediate allocation. Industry reports from the American Gaming Association note parallel shifts in player behavior following similar policy adjustments in North American markets. Meanwhile, academic papers hosted through university repositories continue to explore how these external pressures interact with internal risk thresholds that players set for themselves.
Conclusion
Patterns in bankroll allocation among frequent multi-table tournament participants continue to evolve alongside platform tools, series calendars, and regional policy developments. Data compiled through July 2026 underscores consistent segmentation practices that differentiate experience levels and volume preferences, while external sources such as those from the Responsible Gambling Council provide broader context on how these strategies intersect with player sustainability metrics. Ongoing collection of session-level statistics promises further refinement of these observed frameworks in subsequent periods.